APPENDIX 3 Oxygen Deficiency Hazards (ODH)
(Taken largely from CEBAF Cryogenic Safety Manual)
Definitions
Oxygen Deficiency – the condition of the partial
pressure of atmospheric oxygen being less that 135 mmHg (about 18% by volume at
a barometric pressure of 740 mmHg at ANL).
[American Conference of Governmental Industrial Hygienists]
Procedures
1. A quantitative assessment of the increased risk of fatality from (potential) exposure to
reduced atmospheric oxygen shall be conducted for all operations which are
physically capable of exposing individuals to an oxygen deficiency. This assessment shall specify the Oxygen
Deficiency Hazard Class as well as any unusual precautionary requirements.
2. Precautionary measures shall be
implemented according to the ODH Class unless otherwise stated in the risk
assessment. ODH Class 0 is the
least hazardous and requires no special precautions. ODH Class 4 is the most hazardous and
requires the greatest precautions.
Effects
of Exposure to Reduced Atmospheric Oxygen
Air normally
contains about 21%1 oxygen with the remainder consisting mostly of
nitrogen. Individuals exposed to
reduced-oxygen atmospheres may suffer a variety of harmless effects. Table I contains a list of some of these
effects and the sea level oxygen concentrations at which they occur. At higher altitudes the same effects
generally occur at greater volume concentrations since the partial pressure of
oxygen is less. If exposure to
reduced oxygen is terminated early enough, effects are generally
reversible. If not, permanent
central nervous system damage or lethality result. Major effects hindering escape from the
vicinity of an oxygen deficiency are disorientation and unconsciousness.
In general,
the intensities of the effects increase rapidly with falling oxygen
concentration and longer exposure duration: reduced abilities, then unconsciousness,
then death. It can be concluded
that any exposure to an atmosphere containing less than 17% oxygen presents a
risk.
1Although this section is written in terms of %O2
at sea level, the preferred index of hazard is partial pressure of O2. Percent O2 is used here to
maintain consistency with the “readouts” on oxygen monitors.
TABLE I.
Effect Thresholds for
Exposure to Reduced Oxygen
(Healthy Individuals
at Sea Level)
|
|
Effect
|
|
|
|
|
17
|
Night vision reduced
|
|
Increased breathing volume
|
|
Accelerated heartbeat
|
|
|
|
16
|
Dizziness
|
|
Reaction time for novel tasks doubled
|
|
|
|
15
|
Impaired attention
|
|
Impaired judgment
|
|
Impaired coordination
|
|
Intermittent breathing
|
|
Rapid fatigue
|
|
Loss of muscle control
|
|
|
|
12
|
Very faulty judgment
|
|
Very poor muscular coordination
|
|
Loss of consciousness
|
|
Permanent brain damage
|
|
|
|
10
|
Inability to move
|
|
Nausea
|
|
Vomiting
|
|
|
|
6
|
Spasmatic breathing
|
|
Convulsive movements
|
|
Death in 5-8 minutes
|
ODH Risk
Assessment
The goal of ODH risk assessment is to estimate the rate at
which fatalities will occur as a result of exposure to reduced-oxygen
atmospheres.
Since the level of risk is tied to the nature of the operation,
the fatality rate shall be determined on an operation-by-operation basis. For the given operation several events
may cause an oxygen deficiency.
Each even has an expected rate of occurrence and each occurrence has an
expected probability of killing someone.
The oxygen deficiency hazard fatality is defined as:
 (1) (1)
where f = the ODH fatality rate (per
hour)
Pi = the expected rate of the ith event
(per hour), and
Fi = the fatality factor for the ith event.
The summation shall be taken over all events which may cause
oxygen deficiency and result in fatality.
When possible, the value of Pi shall be determined by
operating experience at ANL; otherwise, data from similar systems elsewhere or
other relevant values shall be used.
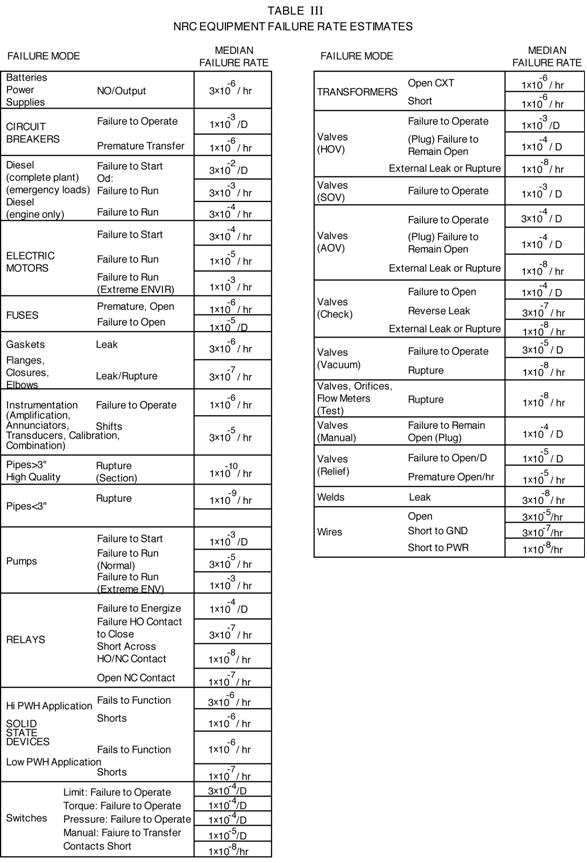
Estimates of “spontaneous” equipment failures
rates are given in Tables II and III.
The former contains median estimates collected from past ODH risk
assessments at Fermilab. The latter
contains values derived from the nuclear power industry.
General human error rate estimates are presented in Table
IV. Table V lists conservative
estimates of the rate of human error as a function of task type and time limit.
TABLE II
Fermilab Equipment
Failure Rate Estimates
|
Failure Mode
|
Estimated Media
Failure Rate
|
|
|
|
|
|
Compressor
(Cryogenic)
|
Leak or Rupture
|
3 x 10⁻⁵/hr
|
|
|
|
Dewar
|
Leak or Rupture
|
1 x 10⁻⁶/hr
|
|
|
|
Electrical Power Failure
(unplanned)
|
Time Rate
(Time Off)
|
|
|
|
|
|
|
Fluid Line (Cryogenic)
|
Leak or Rupture
|
3 x 10⁻⁶/hr
|
|
|
|
Magnet (Cryogenic)
|
Leak or Rupture
|
1 x 10⁻⁶/hr
|
|
|
|
U-Tube Change
Release
(Cryogenic)
|
Large Event
|
1 x 10⁻³/hr
4 x 10⁻⁵/hr
|
Human Error Rate
Estimates
10-3 Selection
of a switch (or pair of switches) dissimilar in shape or location to the
desired switch (or pair of switches), assuming no decision error. For example, operator actuates
large-handled switch rather than small switch.
3 x
10-3 General
human error of commission, e.g., misreading label and therefore selecting wrong
switch.
10-2 General
human error of omission where there is no display in the control room of the
status of the item omitted, e.g. failure to return manually-operated test valve
to proper configuration after maintenance.
3 x
10-3 Errors
of omission, where the items being omitted are embedded in a procedure rather
than at the end as above.
1/x Given
that an operator is reaching for an incorrect switch (or pair of switches), he
selects a particular similar-appearing switch (or pair of switches), where x =
the number of incorrect switches (or pair of switches) adjacent to the desired
switch (or pair of switches). The
1/x applies up to 5 or 6 items.
After that point the error rate would be lower because the operator
would take more time to search.
With up to 5 or 6 items he doesn’t expect to be wrong and,
therefore, is more likely to do less deliberate searching.
10-1 Monitor
or inspector fails to recognize initial error by operator. Note: With continuing feedback of the error on
the annunciator panel, this high error rate would not apply.
10-1 Personnel
on different work shifts fail to check condition of hardware unless required by
check or written directive.
5 x 10⁻¹ Monitor
fails to detect undesired position of valves, etc. during general walk-around
inspections, assuming no checklist is used.
.2 - .3 General
error rate given very high stress levels where dangerous activities are
occurring rapidly.
2(n-1)x Given
severe time stress, as in trying to compensate for an error made in an
emergency situation, the initial error rate, x, for an activity doubles for
each attempt, n, after a previous incorrect attempt, until the limiting
condition of an error rate of 1.0 is reached or until time runs out. This limiting condition corresponds to
an individual’s becoming completely disorganized or ineffective.
TABLE V
Human Error
Rate as a Function of Response Time
Response
Time(s)
|
Maximum Estimated Error Rate (D-1)
|
Skill Based Task
|
Rule Based Task
|
Knowledge Based Task
|
|
|
|
|
|
|
10-4
|
37
|
600
|
18,000
|
|
10-3
|
26
|
300
|
10,000
|
|
10-2
|
16
|
130
|
4,900
|
|
10-1
|
8.7
|
42
|
1,800
|
|
5 x 10⁻¹
|
4.0
|
10
|
550
|
Skill-Based
Task – An individual initiates a single-step learned response upon
receipt of an unambiguous sensor cue.
(Example: A lone worker
initiates escape upon hearing an oxygen deficiency alarm.)
Rule-Based
Task – An individual or small group of individuals diagnoses and
initiates corrective actions for a simple problem given limited or ambiguous
input. (Example: Several workers decide whether or not to
escape given that one of them passes out but no oxygen deficiency alarms
sound.)
Knowledge-Based
Task – A group of individuals diagnoses and initiates corrective
actions for a novel and/or complex problem.
The value
of Fi is the probability that a person will die if the ith event
occurs. This value depends on the
oxygen concentration, the duration of exposure and the difficulty of
escape. For convenience of
calculation, a relationship between the value of Fi and the lowest
attainable oxygen concentration is defined (Figure 1). The lowest concentration is used rather
than an average since the minimum value is conservative and not enough is
understood to allow the definition of an averaging period. If the lowest oxygen concentration is
greater than 18%, then the value of Fi is zero. That is, all exposures above 18% are
defined to be “safe” and to not contribute to fatality. It is assumed that all exposures to 18%
oxygen or lower do contribute to fatality and the value of Fi is
designed to reflect this dependence.
If the lowest attainable oxygen concentration is 18%, then the value of
Fi is 10-7.
This value would cause 0 to be 10-7 per hour if the expected
rate of occurrence of the event were one per hour. At decreasing concentrations the value
of Fi should increase until, at some point, the probability of dying
becomes unity. That point was
selected to be 8.8% oxygen, the concentration at which one minute of
consciousness is expected.
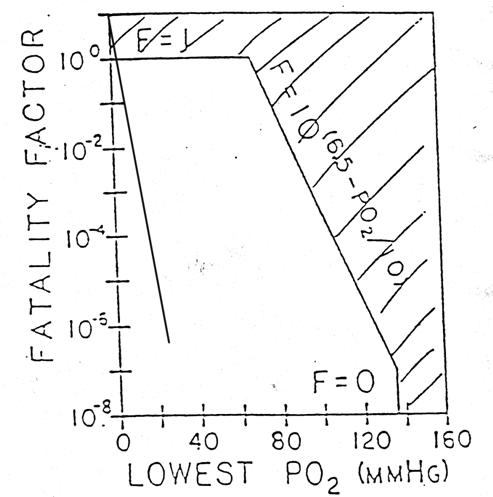
Fig. 1. Graph of the logarithm of the fatality factor
(Fi) versus the lowest attainable oxygen concentration which can
result from a given event. This
relationship should be used when no better estimate of the probability of
fatality from a given event is available.
The oxygen concentration is a confined volume during and
after a release of inert gas may be approximated from the following
differential equation
 (2) (2)
V
= the confined volume (ft3 or m3)
C
= the concentration of oxygen
R
= the spill rate into the confined volume (cfm or m3/s)
Q
= the rate of ventilation through the confined volume (cfm or m3/s).
In order to solve this differential, the following
assumptions are made:
·
Complete, instantaneous mixing takes place in
the confined volume
·
V, R, Q, and the total pressure remain constant
·
The initial oxygen concentration is 21%.
Therefore, the oxygen
concentration during the release is
 (3) (3)
where t is the time from the start of the release. After the release has ended, the oxygen
concentration is
 (4) (4)
where t is the time after the end of the release (when R
becomes zero) and te is the duration of the release.
Once the ODH fatality rate (f) has been determined, the
operation shall be assigned an ODH class according to Table VI.
TABLE VI
Oxygen Deficiency
Hazard Class
4.
Gas dynamics
a.
Ventilation
i.
Natural
ii.
Forced
b. Stratification/mixing
c.
Diffusion
|