This web page presents two-nucleon momentum distributions calculated for various light nuclei in the range A=3-12. Corresponding single-nucleon momentum distributions can be found here. These are from variational Monte Carlo calculations (VMC) using either the Argonne v18 two-nucleon and Urbana X three-nucleon potentials (AV18+UX) or one of the Norfolk Δ-full chiral effective field theory interactions: NV2+3-Ia, -Ia*, -Ib*, -IIa*, -IIb*.
Original density and momentum distribution results for AV18+UX were reported
in:
Wiringa, et al., Phys. Rev. C 89, 024305 (2014).
The results with Norfolk chiral EFT interactions are reported in:
Piarulli, et al., Phys. Rev C 107, 014314 (2023).
Please cite the above papers when using results from these pages.
These VMC wave functions are the starting trial functions for a
number of recent Green's function Monte Carlo (GFMC) calculations:
Brida, et al., Phys. Rev. C 84, 024319 (2011);
McCutchan, et al., Phys. Rev. C 86, 024315 (2012);
Pastore, et al., Phys. Rev. C 87, 035503 (2013);
Datar, et al., Phys. Rev. Lett. 111, 062502 (2013);
Pastore, et al., Phys. Rev. C 90, 024321 (2014).
More details of the wave function construction can be found in
Wiringa, Phys. Rev. C 43, 1585 (1991) for A=3,4;
Pudliner, et al., Phys. Rev. C 56, 1720 (1997) for A=6,7;
Wiringa, et al., Phys. Rev. C 62, 014001 (2000) for A=8;
Pieper, et al., Phys. Rev. C 70, 044310 (2002) for A=9,10.
An excellent overall review of quantum Monte Carlo methods for nuclei
can be found at:
The Norfolk interactions are described and used in the following papers:
Some of the results are distributions for relative pair momenta
q = (k1-k2)/2 projected into total pair spin
S=0 or 1 and isospin T=0 or 1.
Other results are generated as a function of both q and total pair momentum
Q = (k1+k2) projected into pp, np, and nn pairs.
The two-nucleon densities corresponding to these wave
functions are given here.
Carlson, et al., Rev. Mod. Phys. 87, 1067 (2015)
Piarulli, et al., Phys. Rev. C 94, 054007 (2016).
Piarulli, et al., Phys. Rev. Lett. 120, 052503 (2018).
Baroni, et al., Phys. Rev. C 98, 044003 (2018).
Schiavilla, et al., Phys. Rev. C 99, 034005 (2019).
ST Pair momentum distributions as functions of q
Following are files for various nuclei tabulating and illustrating
the ST-projected pair momentum distributions ρST(q)
as a function of the relative momentum
q = (k1-k2)/2 between pairs.
The normalization of these distributions is given by
where NST is the total number of pairs with total spin S=0 or 1 and T=0 or 1.
|
3H(1/2+) AV18+UX Figure Table |
3H(1/2+) NV2+3-Ia Figure Table |
3H(1/2+) NV2+3-Ia* Figure Table |
3H(1/2+) NV2+3-Ib* Figure Table |
3H(1/2+) NV2+3-IIa* Figure Table |
3H(1/2+) NV2+3-IIb* Figure Table |
|||
|
3He(1/2+) AV18+UX Figure Table |
3He(1/2+) NV2+3-Ia Figure Table |
3He(1/2+) NV2+3-Ia* Figure Table |
3He(1/2+) NV2+3-Ib* Figure Table |
3He(1/2+) NV2+3-IIa* Figure Table |
3He(1/2+) NV2+3-IIb* Figure Table |
|||
|
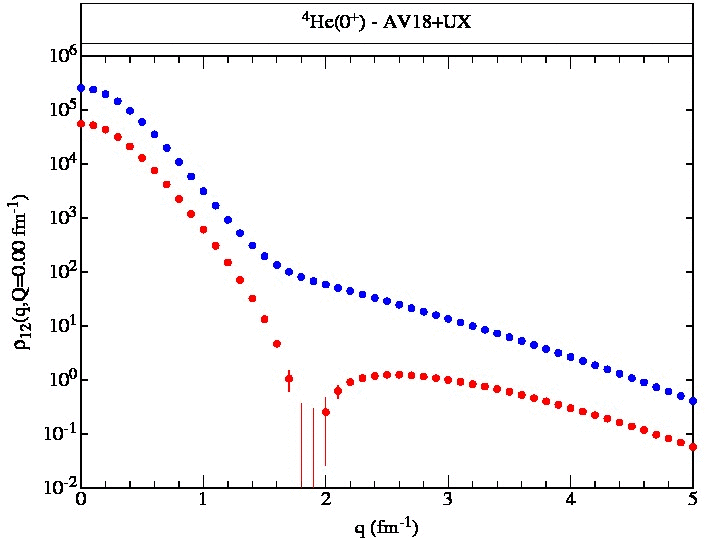
4He(0+) AV18+UX Figure Table Table (v18) |
4He(0+) NV2+3-Ia Figure Table |
4He(0+) NV2+3-Ia* Figure Table |
4He(0+) NV2+3-Ib* Figure Table |
4He(0+) NV2+3-IIa* Figure Table |
4He(0+) NV2+3-IIb* Figure Table |
|||
|
6Li(1+) AV18+UX Figure Table |
6Li(1+) NV2+3-Ia Figure Table |
6Li(1+) NV2+3-Ia* Figure Table |
6Li(1+) NV2+3-Ib* Figure Table |
6Li(1+) NV2+3-IIa* Figure Table |
6Li(1+) NV2+3-IIb* Figure Table |
|||
|
7Li(3/2-) AV18+UX Figure Table |
7Li(3/2-) NV2+3-Ia Figure Table |
7Li(3/2-) NV2+3-Ia* Figure Table |
7Li(3/2-) NV2+3-Ib* Figure Table |
7Li(3/2-) NV2+3-IIa* Figure Table |
7Li(3/2-) NV2+3-IIb* Figure Table |
|||
|
8He(0+) AV18+UX Figure Table |
8He(0+) NV2+3-Ia Figure Table |
8He(0+) NV2+3-Ia* Figure Table |
8He(0+) NV2+3-Ib* Figure Table |
8He(0+) NV2+3-IIa* Figure Table |
8He(0+) NV2+3-IIb* Figure Table |
8Be(0+) AV18+UX Figure Table |
||
|
9Be(3/2-) AV18+UX Figure Table |
9Be(3/2-) NV2+3-Ia Figure Table |
9Be(3/2-) NV2+3-Ia* Figure Table |
9Be(3/2-) NV2+3-Ib* Figure Table |
9Be(3/2-) NV2+3-IIa* Figure Table |
9Be(3/2-) NV2+3-IIb* Figure Table |
|||
|
10B(3+) AV18+UX Figure Table |
10B(3+) NV2+3-Ia Figure Table |
10B(3+) NV2+3-Ia* Figure Table |
10B(3+) NV2+3-IIb* Figure Table |
|||||
|
12C(0+) AV18+UX Figure Table |
|
3H(1/2+) AV18+UX Figure Table |
3H(1/2+) NV2+3-Ia Figure Table |
3H(1/2+) NV2+3-Ia* Figure Table |
3H(1/2+) NV2+3-Ib* Figure Table |
3H(1/2+) NV2+3-IIa* Figure Table |
3H(1/2+) NV2+3-IIb* Figure Table |
|||
|
3He(1/2+) AV18+UX Figure Table |
3He(1/2+) NV2+3-Ia Figure Table |
3He(1/2+) NV2+3-Ia* Figure Table |
3He(1/2+) NV2+3-Ib* Figure Table |
3He(1/2+) NV2+3-IIa* Figure Table |
3He(1/2+) NV2+3-IIb* Figure Table |
|||
|
4He(0+) AV18+UX Figure Table Table (v18) |
4He(0+) NV2+3-Ia Figure Table |
4He(0+) NV2+3-Ia* Figure Table |
4He(0+) NV2+3-Ib* Figure Table |
4He(0+) NV2+3-IIa* Figure Table |
4He(0+) NV2+3-IIb* Figure Table |
|||
|
6He(0+) AV18+UX Figure Table |
6He(0+) NV2+3-Ia Figure Table |
6He(0+) NV2+3-Ia* Figure Table |
6He(0+) NV2+3-Ib* Figure Table |
6He(0+) NV2+3-IIa* Figure Table |
6He(0+) NV2+3-IIb* Figure Table |
|||
|
6Li(1+) AV18+UX Figure Table |
6Li(1+) NV2+3-Ia Figure Table |
6Li(1+) NV2+3-Ia* Figure Table |
6Li(1+) NV2+3-Ib* Figure Table |
6Li(1+) NV2+3-IIa* Figure Table |
6Li(1+) NV2+3-IIb* Figure Table |
|||
|
7Li(3/2-) AV18+UX Figure Table |
7Li(3/2-) NV2+3-Ia Figure Table |
7Li(3/2-) NV2+3-Ia* Figure Table |
7Li(3/2-) NV2+3-Ib* Figure Table |
7Li(3/2-) NV2+3-IIa* Figure Table |
7Li(3/2-) NV2+3-IIb* Figure Table |
|||
|
8He(0+) AV18+UX Figure Table |
8He(0+) NV2+3-Ia Figure Table |
8He(0+) NV2+3-Ia* Figure Table |
8He(0+) NV2+3-Ib* Figure Table |
8He(0+) NV2+3-IIa* Figure Table |
8He(0+) NV2+3-IIb* Figure Table |
|||
|
8Li(2+) AV18+UX Figure Table |
8Li(2+) NV2+3-Ia Figure Table |
8Li(2+) NV2+3-Ia* Figure Table |
8Li(2+) NV2+3-Ib* Figure Table |
8Li(2+) NV2+3-IIa* Figure Table |
8Li(2+) NV2+3-IIb* Figure Table |
|||
|
8Be(0+) AV18+UX Figure Table |
8Be(0+) NV2+3-Ia Figure Table |
8Be(0+) NV2+3-Ia* Figure Table |
8Be(0+) NV2+3-IIb* Figure Table |
|||||
|
9Li(3/2-) AV18+UX Figure Table |
9Li(3/2-) NV2+3-Ia Figure Table |
9Li(3/2-) NV2+3-Ia* Figure Table |
9Li(3/2-) NV2+3-IIb* Figure Table |
|||||
|
9Be(3/2-) AV18+UX Figure Table |
9Be(3/2-) NV2+3-Ia Figure Table |
9Be(3/2-) NV2+3-Ia* Figure Table |
9Be(3/2-) NV2+3-Ib* Figure Table |
9Be(3/2-) NV2+3-IIa* Figure Table |
9Be(3/2-) NV2+3-IIb* Figure Table |
|||
|
10Be(0+) AV18+UX Figure Table |
10B(3+) AV18+UX Figure Table |
10B(3+) NV2+3-Ia Figure Table |
10B(3+) NV2+3-Ia* Figure Table |
10B(3+) NV2+3-IIb* Figure Table |
||||
|
12C(0+) AV18+UX Figure Table |
12C(0+) NV2+3-Ia* Figure Table |
|
3H(1/2+) AV18+UX Figure Table |
3He(1/2+) AV18+UX Figure Table |
||||
|
4He(0+) AV18+UX Figure Table Table (v18) |
|||||
|
6He(0+) AV18+UX Figure Table |
6Li(1+) AV18+UX Figure Table |
||||
|
8He(0+) AV18+UX Figure Table |
8Be(0+) AV18+UX Figure Table |
||||
|
10Be(0+) AV18+UX Figure Table |
10B(3+) AV18+UX Figure Table |
||||
|
12C(0+) AV18+UX Figure Table |
|
3He(1/2+) AV18+UX (q,Q=0-0.5) (q,Q=0-1) (q,Q=0-5) (q,Q,r<2.5) (q,Q,r>2.5) np(q,Q,r<,r>) pp(q,Q,r<,r>) |
3He(1/2+) NV2+3-Ia* (q,Q=0-0.5) (q,Q=0-1) (q,Q=0-5) (q,Q,r<2.5) (q,Q,r>2.5) np(q,Q,r<,r>) pp(q,Q,r<,r>) |
3He(1/2+) NV2+3-IIb* (q,Q=0-0.5) (q,Q=0-1) (q,Q=0-5) (q,Q,r<2.5) (q,Q,r>2.5) np(q,Q,r<,r>) pp(q,Q,r<,r>) |
|
3He(1/2+) AV18+UX Table (all) Table (r<) Table (r>) |
3He(1/2+) NV2+3-Ia* Table (all) Table (r<) Table (r>) |
3He(1/2+) NV2+3-IIb* Table (all) Table (r<) Table (r>) |
|
4He(0+) AV18+UX (q,Q=0-0.5) (q,Q=0-1) (q,Q=0-5) (q,Q,r<2.5) (q,Q,r>2.5) np(q,Q,r<,r>) pp(q,Q,r<,r>) |
4He(0+) NV2+3-Ia* (q,Q=0-0.5) (q,Q=0-1) (q,Q=0-5) (q,Q,r<2.5) (q,Q,r>2.5) np(q,Q,r<,r>) pp(q,Q,r<,r>) |
4He(0+) NV2+3-IIb* (q,Q=0-0.5) (q,Q=0-1) (q,Q=0-5) (q,Q,r<2.5) (q,Q,r>2.5) np(q,Q,r<,r>) pp(q,Q,r<,r>) |
|
4He(0+) AV18+UX Table (all) Table (r<) Table (r>) |
4He(0+) NV2+3-Ia* Table (all) Table (r<) Table (r>) |
4He(0+) NV2+3-IIb* Table (all) Table (r<) Table (r>) |
|
6Li(1+) AV18+UX (q,Q=0-0.5) (q,Q=0-1) (q,Q=0-5) (q,Q,r<2.5) (q,Q,r>2.5) np(q,Q,r<,r>) pp(q,Q,r<,r>) |
6Li(1+) NV2+3-Ia* (q,Q=0-0.5) (q,Q=0-1) (q,Q=0-5) (q,Q,r<2.5) (q,Q,r>2.5) np(q,Q,r<,r>) pp(q,Q,r<,r>) |
6Li(1+) NV2+3-IIb* (q,Q=0-0.5) (q,Q=0-1) (q,Q=0-5) (q,Q,r<2.5) (q,Q,r>2.5) np(q,Q,r<,r>) pp(q,Q,r<,r>) |
|
6Li(1+) AV18+UX Table (all) Table (r<) Table (r>) |
6Li(1+) NV2+3-Ia* Table (all) Table (r<) Table (r>) |
6Li(1+) NV2+3-IIb* Table (all) Table (r<) Table (r>) |
|
12Be(0+) AV18+UX (q,Q=0-1) (q,Q=0-2) (q,Q=0-4) |
12Be(0+) NV2+3-Ia* (q,Q=0-1) (q,Q=0-2) (q,Q=0-4) |
12C(0+) AV18+UX (q,Q=0-0.5) (q,Q=0-1) (q,Q=0-5) (q,Q,r<2.5) (q,Q,r>2.5) np(q,Q,r<,r>) pp(q,Q,r<,r>) |
12C(0+) NV2+3-Ia* (q,Q=0-1) (q,Q=0-2) (q,Q=0-4) |
|
12Be(0+) AV18+UX Table (all) |
12Be(0+) NV2+3-Ia* Table (all) |
12C(0+) AV18+UX Table (all) Table (r<) Table (r>) |
12C(0+) NV2+3-Ia* Table (all) |
Robert B. Wiringa
Last update October 9, 2023